The Only Hiring Metrics That Matter in 2025 (And How to Actually Use Them)
This Week in the Holistic Recruiter Club #025
👋 TA leaders, recruiters, and hiring managers – are you ready for 2025?
Thanks again for joining me and reading! If you like this Newsletter a share to a friend or colleague goes a long way! So thanks to all of you that have done that recently :)
Now we’re facing one of the most unpredictable years in hiring I’ve seen and I’ve recruited through two recessions and it doesn’t feel great or look like stabilising. That’s my conclusion after I went to HR Technologies France on Wednesday and what shocked me was nearly every supplier said one of these things: -
📉 TA teams are shrinking, hiring is slowing, and budgets are tighter than ever. And suppliers are feeling the pinch.
🌍 Economic shifts (inflation, layoffs, global elections) are re-shaping how people are viewing and approaching recruitment.
My conclusion is that 🤖 AI is rewriting how we hire people into the companies not replacing them, at least not yet anyway. This also means a slowdown in technology investment and innovation. All in all, it wasn’t very positive! And I love positivity!
Having said that we can be doing good things to prepare for when the economy comes back.
I also had my first French lesson in a while, which actually went very well. I love France but you really need to speak a half-decent level to get on day to day. And when it comes to business people in France naturally want to speak French, so I have no choice really! 😅
From next week I will start to share a TA Tip as promised in my first edition of 2025! If there are any topics you are particularly interested in let me know and I can start there. Pop me a message.
Recruitment Campaigns You May Not Have Seen
This one is from Beamery who are an AI powered HR SaaS platform for recruitment (No this is not sponsored!) But I really love this video, so authentic, not polisehed but still polished, I think its hard not to have a laugh with them and also shows you the reality of what its like recording these things! I remember by my first one it took me about 30 takes to say what I did haha.
Anyway well done ladies and gents good job!
🚀 Turning Research Into Actions: 7 Part Series of The Most Effective Hiring Process. Part 4/7
Part 4/7: Metrics That Actually Matter
Over the past few weeks, we’ve been building the ultimate evidence-based hiring process step by step:
Week 1: The history of hiring and selection
Week 2: What actually predicts job performance (spoiler alert! Structured interviews and job-specific assessments win).
Week 3: How to design a hiring process that balances efficiency, fairness, and candidate experience.
Now we face another big question I am often asked: How do we measure success?
For this I want to take a look at “What’s a Driver Metric” is. This is something I learned a lot working for a product and combining the product sales and other business metrics to help us understand what we need to do to move the needle.
A driver metric directly influences hiring success. If you improve these, everything else improves too.
Something Nico Meunier from talent.io used to tell me is, that if you’re not measuring you are not learning. If you can’t measure it, you can’t improve it. But here’s the problem:
❌ Most hiring metrics don’t actually tell you if you made a good hire.
❌ TA teams track “time to hire” and “cost per hire” but struggle to show impact.
❌ HR leaders want hiring data but often don’t know what “good” looks like.
This week, we’re fixing that. Here are the only hiring metrics you need in 2025—how to track them, what "good" looks like, and how they actually help you hire better.
So here we go…. I know you all love data… Stay with me
Time to Impact (Not Just Time to Hire) ⏳
💡 Speed is irrelevant if the hire isn’t effective. Time to Impact measures how long it takes a new hire to reach full productivity.
Why You Should Care
A hire made in 30 days who takes 6 months to ramp up = 🚩 not a win.
A hire made in 45 days who contributes in 2 months = 🎯 strong hire.
If time to impact is too long, your hiring process is prioritising speed over quality.
🧮 How to Calculate It 🧮
Time to Impact = (Date of Full Productivity - Start Date)
( ‘Full productivity’ is a defined success benchmark—e.g., hitting KPIs, revenue targets, closing X deals in sales.)
Simple Example:
You hire a Sales Manager on Jan 1.
They close their first 5 deals on April 1 (your full productivity benchmark).
Time to Impact = 90 days.
How to Work on It:
Set a clear 90-day success plan for all new hires.
Align with hiring managers on realistic ramp-up expectations.
Track onboarding effectiveness with manager feedback.
Top Tip: Test this metric with one manager-level role or a high-volume position (e.g., sales reps, recruiters) where multiple hires allow comparison.
Hiring Velocity (Are You Losing Candidates to Slow Hiring?) 🏃♂️💨
💡 If you’re losing candidates to faster-moving companies, your process may be the problem.. Hiring Velocity measures how long each hiring stage takes.
Why You Should Care
If applicants drop off before interviews, screening is too slow.
If candidates ghost after final rounds, offer turnaround is too slow.
Faster hiring doesn’t mean worse hiring it means fewer missed opportunities.
🧮 How to Calculate It 🧮
Hiring Velocity = (Total Days to Hire / Number of Stages)
Simple Example :
Your hiring process takes 40 days with 4 stages.
Hiring Velocity = 10 days per stage.
But if screening takes 15 days, you know where the slowdown is.
How to Work on It:
Use AI-driven tools to screen faster (e.g, Chatbots, ATS automation etc).
Set hiring manager SLAs for response times.
Use pre-scheduled interview blocks to eliminate delays.
Top Tip: Test this with a role that’s historically slow to fill see where delays happen and cut unnecessary steps.
Candidate NPS Score ⭐
💡 Better candidate experience = better hiring outcomes. It measures how candidates perceive and rate their hiring experience.
Why You Should Care
A bad experience means declined offers.
Candidates talk. One bad experience = negative Glassdoor review.
The best candidates expect fast, respectful, engaging hiring processes.
🧮 How to Calculate It 🧮
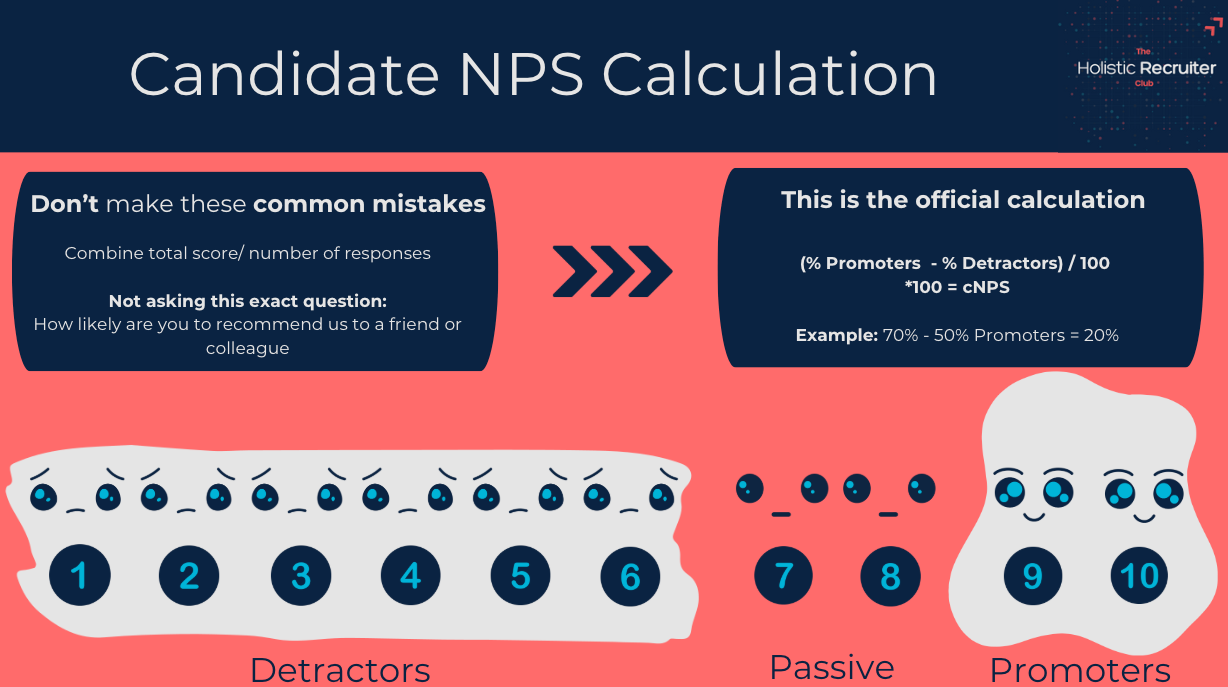
Candidate NPS Score = (Positive Feedback / Total Survey Responses) × 100
Simple Example Calculation:
50 rate 9 or 10 → Promoters
30 rate 7 or 8 → Passives (ignored in NPS)
20 rate 0-6 → Detractors
Answer:
( 50-20 ) /100 would be 30/100 0.3 *100
How to Improve It:
Send post-interview surveys with a simple NPS-style rating.
Audit your process, what’s frustrating candidates?
Fix common complaints (e.g., lack of feedback, ghosting, slow timelines).
Top Tip: Implement this for a high-visibility role (e.g., Sales, Tech, Leadership) to gauge impact.
Pro Tip: If you want to move beyond just basic Candidate NPS let me know, and if enough of you say yes I will write something about it.
Offer Acceptance Rate (Are You Winning or Losing?) 🎯
💡 A low acceptance rate means something is wrong, either your process, your offer, or your reputation. This measures how often candidates accept your job offers.
Now you may say this is too simple or why are you telling me, but how many of you could locate this information right now? Or who has audited the whole process to understand why? What is good per role, department or manager or TA for example?
Why You Should Care
If too many candidates decline, you could be too slow, lowballing offers, or losing to competitors.
If your best candidates say no, hiring velocity & candidate experience might be the problem.
🧮 How to Calculate It 🧮
Offer Acceptance Rate = (Accepted Offers / Total Offers) × 100
Simple Example:
You extend 10 offers.
7 candidates accept.
Offer Acceptance Rate = 70%.
How to Improve It:
Speed up the offer process final interview to offer should be <48 hours.
Benchmark salary & benefits against competitors—don’t lose talent over £5K.
Get direct feedback from declined offers don’t assume, ask why.
Top Tip: Sometimes the basics are what you need to get right first. Not everything complicated or fancy will get you the desired outcomes.
How to Set Meaningful KPIS and Targets for These Metrics
Measuring without a benchmark = flying blind.
Look at Your Current Data
Start with your historical data. Where are you today? Example:
Time to Impact: 90 days
Hiring Velocity: 45 days per hire
Candidate Experience Score: 75%
Offer Acceptance Rate: 72%
If you don’t or cant calculate now, start collecting the data straight away. Now is always the best next time in the absence of it.
Compare Against Industry Benchmarks
Are you slower or faster than the market?
Tech Hiring (Avg. 30-45 days)
Sales Hiring (Avg. 20-35 days)
Offer Acceptance Rate Benchmark: 85%
How do you get this info? Ask in your community for this type of info - network with friends in the space and find out!
Try this with one job type first, then scale.
Coming Up Next: Week 5
Next week, we’ll tackle optimising the length of the hiring process—how to cut unnecessary steps, speed things up without sacrificing quality, and keep candidates engaged throughout. Plus, I’ll share practical ways to streamline your process without losing great talent.
After that, we’ll dive into customizing selection processes for different roles—because what works for high-volume hiring won’t work for specialised positions.
Funny of the week
Just because it’s too true 😂 I might have to see if we can create an AI song of this haha
Thank you for reading, your feedback is always welcome on how I can improve the newsletter :) If you like the article please like and share and subscribe.
• 📤 Share this newsletter with a colleague who’s rethinking their HR strategy.
• 💬 What’s one HR challenge you’re tackling this month? Reply and let’s discuss!
• 📩 Stay ahead of the curve—subscribe here for next week’s insights.


